
Quick answer: Data center observability is the ability to explain what is happening inside a facility’s infrastructure from the data it emits: metrics, logs and traces, plus physical-layer telemetry such as power draw, inlet temperature and optical receive levels. Monitoring tells you something is wrong. Observability tells you why, and which rack, device and port a technician has to touch.
Most operations teams are not short of data. Switches export interface counters, PDUs report amps per outlet, the building management system logs every chilled-water valve change, and the ticketing system holds years of incident notes. Data center observability is about getting that data to answer questions nobody wrote an alert for, quickly enough to change how an incident ends.
This guide is for infrastructure leaders, operations managers and SRE teams building or rebuilding a telemetry stack. It covers the three classic signal types, where OpenTelemetry fits, and why the physical layer is the part most observability programs get wrong.
We write from the field side. Our technicians are the people who show up when the dashboards turn red, so we see where the data was right and where it sent someone to the wrong rack.
What is data center observability?
Data center observability is the practice of instrumenting every layer of a facility so operators can reason about its internal state from its outputs alone. The concept came from control theory and was popularized by software teams. Data centers add a physical dimension that most software teams never deal with.
A working definition: data center observability is the capability to infer the health and behavior of facility, hardware and network systems from their telemetry, correlated across layers and tied to accurate physical records, so teams can diagnose problems they did not predict.
The OpenTelemetry project puts the general idea well, defining observability as “the ability to understand the internal state of a system by examining its outputs”.
Monitoring vs. observability
Monitoring runs checks you defined in advance. Is the UPS on battery? Is the link up? Is inlet temperature above threshold? Those checks are necessary, and they catch the failures you already know about.
Observability handles the other kind of question. Why did job completion times on one GPU pod slip every afternoon for a week? In a case like that, the answer usually sits in three places at once: the cooling unit maintenance log, per-rack inlet temperatures and thermal throttling events in the server BMC logs. No single alert connects them. An observable environment lets an engineer do it in minutes instead of days.
Logs, metrics and traces: what each signal tells you
Metrics tell you how much, logs tell you what happened, and traces tell you where time went across a chain of components. Each one has a blind spot, which is why a data center needs all three plus physical context.
Signal | What it is | Data center examples | Best for | Blind spot |
|---|---|---|---|---|
Metrics | Numeric measurements sampled over time | Rack inlet temperature, PDU amps, fan RPM, interface errors, optical receive power | Trends, thresholds, capacity planning | Little context on why a value changed |
Logs | Timestamped event records | Switch syslog, BMC system event logs, BMS alarms, badge access entries | Event sequence, forensics | High volume, inconsistent formats |
Traces | The path of a request across services | Storage I/O path, API calls through a load balancer, steps in a distributed job | Latency attribution across components | Stops at the software boundary |
Metrics
Metrics are cheap to store and easy to graph. The trouble starts with scale and sampling. Per-port optical readings across thousands of ports create a lot of time series, and a five-minute polling interval will average away a 40-second power sag or a microburst that dropped packets. Pick the interval based on the failure you are trying to see, not on what the default template ships with.
Logs
Logs carry the richest context and the messiest data. The most common problem we see is unsynchronized clocks. If the BMS clock drifts three minutes from the network gear, a correlation that should be obvious disappears. Time sync across facility and IT systems is boring work that pays off in every investigation.
Traces
Tracing grew up in distributed software, and in a data center it matters for the services running on the infrastructure. A trace can show that a storage call spent most of its time waiting on one node. It cannot tell you that the node’s uplink optic is running hot. That handoff, from application traces to physical telemetry, is where many investigations stall.
Where does OpenTelemetry fit in data center observability?
OpenTelemetry is an open, vendor-neutral standard for generating, collecting and exporting telemetry. It is not a monitoring product or a database.
The project describes itself as an observability framework and toolkit for telemetry data “such as traces, metrics, and logs,” and states plainly that it “is not an observability backend itself.” It is a Cloud Native Computing Foundation project formed from the merger of OpenTracing and OpenCensus. Its practical value is a shared protocol (OTLP) and semantic conventions, so a host name or a service name means the same thing across tools. The OpenTelemetry Collector can also be extended with receivers for custom data sources.
For IT-side signals, adopting OpenTelemetry is a sensible default. Be realistic about the facility side, though. Most power and cooling data still arrives through SNMP, Modbus, BACnet, Redfish or vendor APIs, so expect a translation layer. OpenTelemetry standardizes how telemetry moves. It does not fix inconsistent rack names or a cable map that is two migrations out of date.
Why the physical layer is the usual observability gap
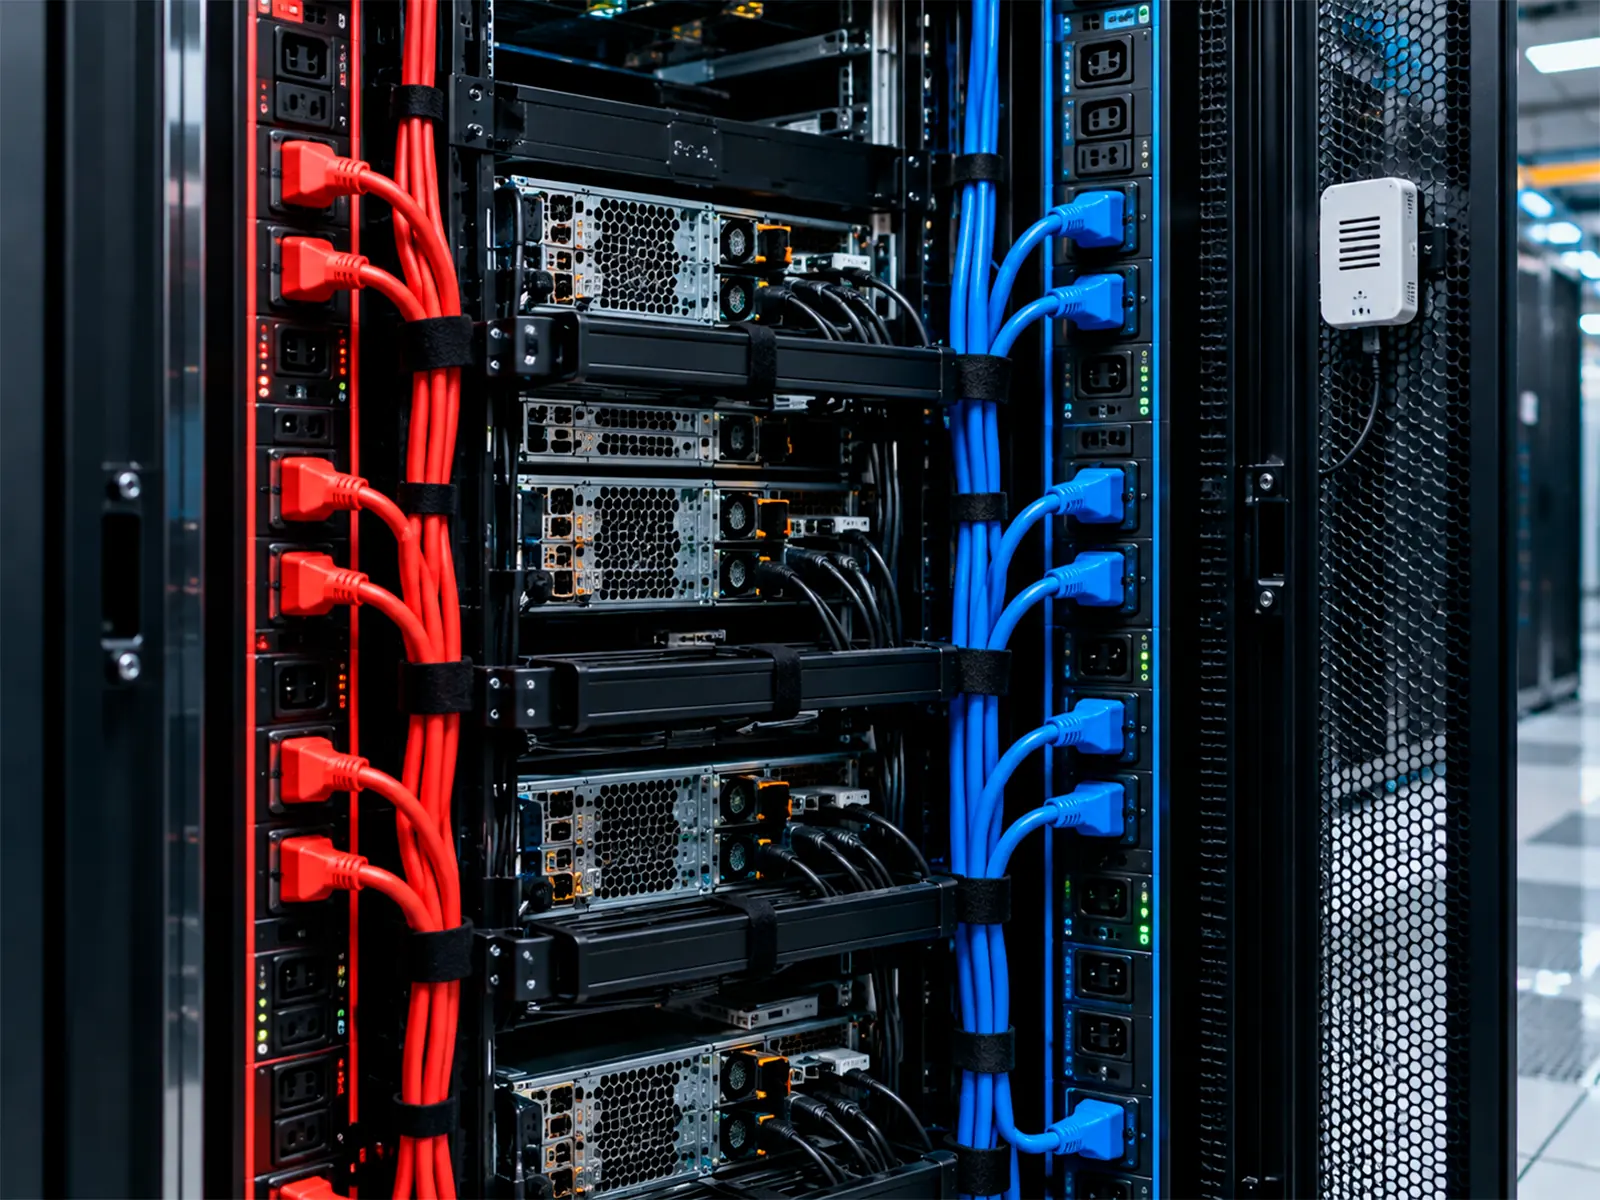
Physical telemetry is split across DCIM, BMS and device management planes, and the records that give it context (rack elevations, port maps, cable routes) go stale the moment someone moves a jumper without updating them.
The physical signals worth collecting:
- Power: UPS, PDU and busway metering, breaker states, battery monitoring.
- Environment: inlet and exhaust temperatures, humidity, differential pressure, leak detection.
- Compute hardware: baseboard management controller data through Redfish or IPMI, including PSU status, fan speeds and memory error counts.
- Optics: digital diagnostic monitoring on transceivers (temperature, laser bias current, transmit and receive power), defined for SFP modules in SFF-8472 and for newer high-density form factors in CMIS.
- Fiber plant: insertion loss and OTDR baselines captured at installation.
- Location records: DCIM rack elevations, patch panel maps, asset tags.
The connectivity piece deserves attention. Uptime Institute’s Annual Outage Analysis 2026 reports that outages linked to fiber and connectivity issues are rising and are more likely to result in extended disruptions.
Telemetry that points at the wrong place
The failure mode we run into most is not missing telemetry. It is telemetry pointing at the wrong location. An alert shows receive power falling on a leaf switch port. The DCIM record says that port runs to position 14 on a panel in the next row. During a migration the jumper was re-patched to position 16, and nobody updated the record. The technician cleans and inspects the wrong connector, the ticket bounces back, and a short fix turns into a second dispatch.
This is why what field teams need from DCIM tools matters as much as the monitoring platform, and why anomaly detection models are only as useful as the location data behind them.
How to build a data center observability practice
Start with the physical truth, then instrument, then correlate. Teams that reverse the order end up with sharp dashboards built on the wrong map.
- Establish physical truth first. Audit rack elevations, port maps, power cord A/B assignments and asset tags against what is actually installed.
- Decide which questions matter. List the incidents you want to diagnose faster and the service levels you report on. That list drives what you instrument.
- Instrument each layer. Facility, power, compute, network, optics and services, each with a sampling interval matched to its failure modes.
- Use one identifier scheme. Site, hall, row, rack, U position and port should read the same on the cable label, in DCIM and in the alert. TIA-606 labeling is a good baseline.
- Synchronize clocks across facility and IT systems.
- Correlate before you alert. Group symptoms by topology and time so one root cause produces one incident. Our guide to what AIOps is and what it needs covers this step in more depth.
- Close the loop with the field. Every dispatch should return evidence (photos, serial numbers, optical readings) and update the record it relied on.
Step 7 is the one most programs skip. It is also the one that keeps steps 1 and 4 true a year later.
What should an observability stack hand to a field technician?
A good alert gives the technician four things: an exact location, the symptom, the evidence and a safe scope of work. If any of them is missing, time on site goes to discovery instead of repair.
Checklist for a dispatch-ready incident:
- Exact location: site, hall, row, rack, U position and port.
- Symptom with its time window and the readings that triggered it.
- Asset identity: model, serial number and whether it holds data.
- Access prerequisites: badge, escort, change window, customer approvals.
- Spares on site or in transit, with tracking.
- Done criteria: the reading that proves the fix, such as receive power back within the optic’s specified range.
Operators that get this handoff right see the payoff described in our analysis of data center uptime ROI: fewer repeat visits and cleaner incident records. It also produces the accurate as-built data that a data center digital twin depends on.
How Hype Telecom helps
Hype Telecom does not sell observability software. We work on the physical side that makes it accurate. Our vetted teams install racks and structured cabling aligned to BICSI, label to a consistent scheme, test and document fiber links, and capture photo evidence at closeout, so the records your platform uses match the floor.
When alerts fire, our Smart Hands and First Line Maintenance (FLM) services put technicians with CompTIA Server+, Network+ and A+ credentials on site, with a historical sub-4-hour emergency response across 50+ active sites in the U.S. and Brazil — an arrival commitment, with SLAs configured per contract — and a 95% first-visit resolution rate. Our coordination team returns closure evidence, including photos, serials and readings, so every dispatch leaves your records more accurate than it found them.
If your telemetry keeps sending technicians to the wrong port, schedule a 15-minute call with a deployment specialist to review how your physical records and field workflow connect.
Frequently asked questions
Monitoring checks conditions you defined in advance, such as a UPS on battery or a link down. Observability lets engineers investigate problems nobody predicted by correlating metrics, logs, traces and physical telemetry across layers. You need both. Monitoring catches known failures fast, and observability shortens the investigation when the cause spans cooling, power, hardware and network at the same time.
The three classic signal types are metrics, logs and traces. Metrics are numeric measurements over time, logs are timestamped event records, and traces follow a request across services. In a data center, a fourth category matters just as much: physical-layer telemetry and location records, such as power, temperature, optical levels, rack elevations and port maps.
OpenTelemetry standardizes how traces, metrics and logs are generated, collected and exported, and its Collector can be extended with receivers for custom sources. Most power and cooling equipment still speaks SNMP, Modbus, BACnet, Redfish or vendor APIs, so facility data usually needs a translation layer. OpenTelemetry does not replace a backend or fix inaccurate asset records.
DCIM holds the location context that turns a reading into an action: which rack, which U position, which panel port. If that record is stale, an accurate alert still sends a technician to the wrong place. Keeping DCIM current through audits and post-dispatch updates is one of the cheapest ways to make an observability investment pay off.
Update records as part of every change, not afterward. On top of that, many operators run periodic sample audits comparing DCIM against the floor, with frequency set by how much change a hall sees. High-churn areas such as AI build-outs or migration zones need checks more often than stable halls. Track the discrepancy rate over time to decide.


2 Responses